IC-ready inside DD timelines
Underwriting that holds up, even on incomplete data-room evidence.
















One case linking pathway, Capex, sequencing, cash flow, and returns, under the fund’s hold period and return targets.
Assumptions, Capex, cash flow, and returns considered together.
Grounded in real constraints and financeable at exit.
Rent, cost, rates, exit assumptions, timing, and Capex.
REAL ESTATE DECISION INTELLIGENCE
Explore the platformOptiml’s offering brings together Capex planning, capital efficiency & return optimization, alongside the decarbonization of buildings & funds.



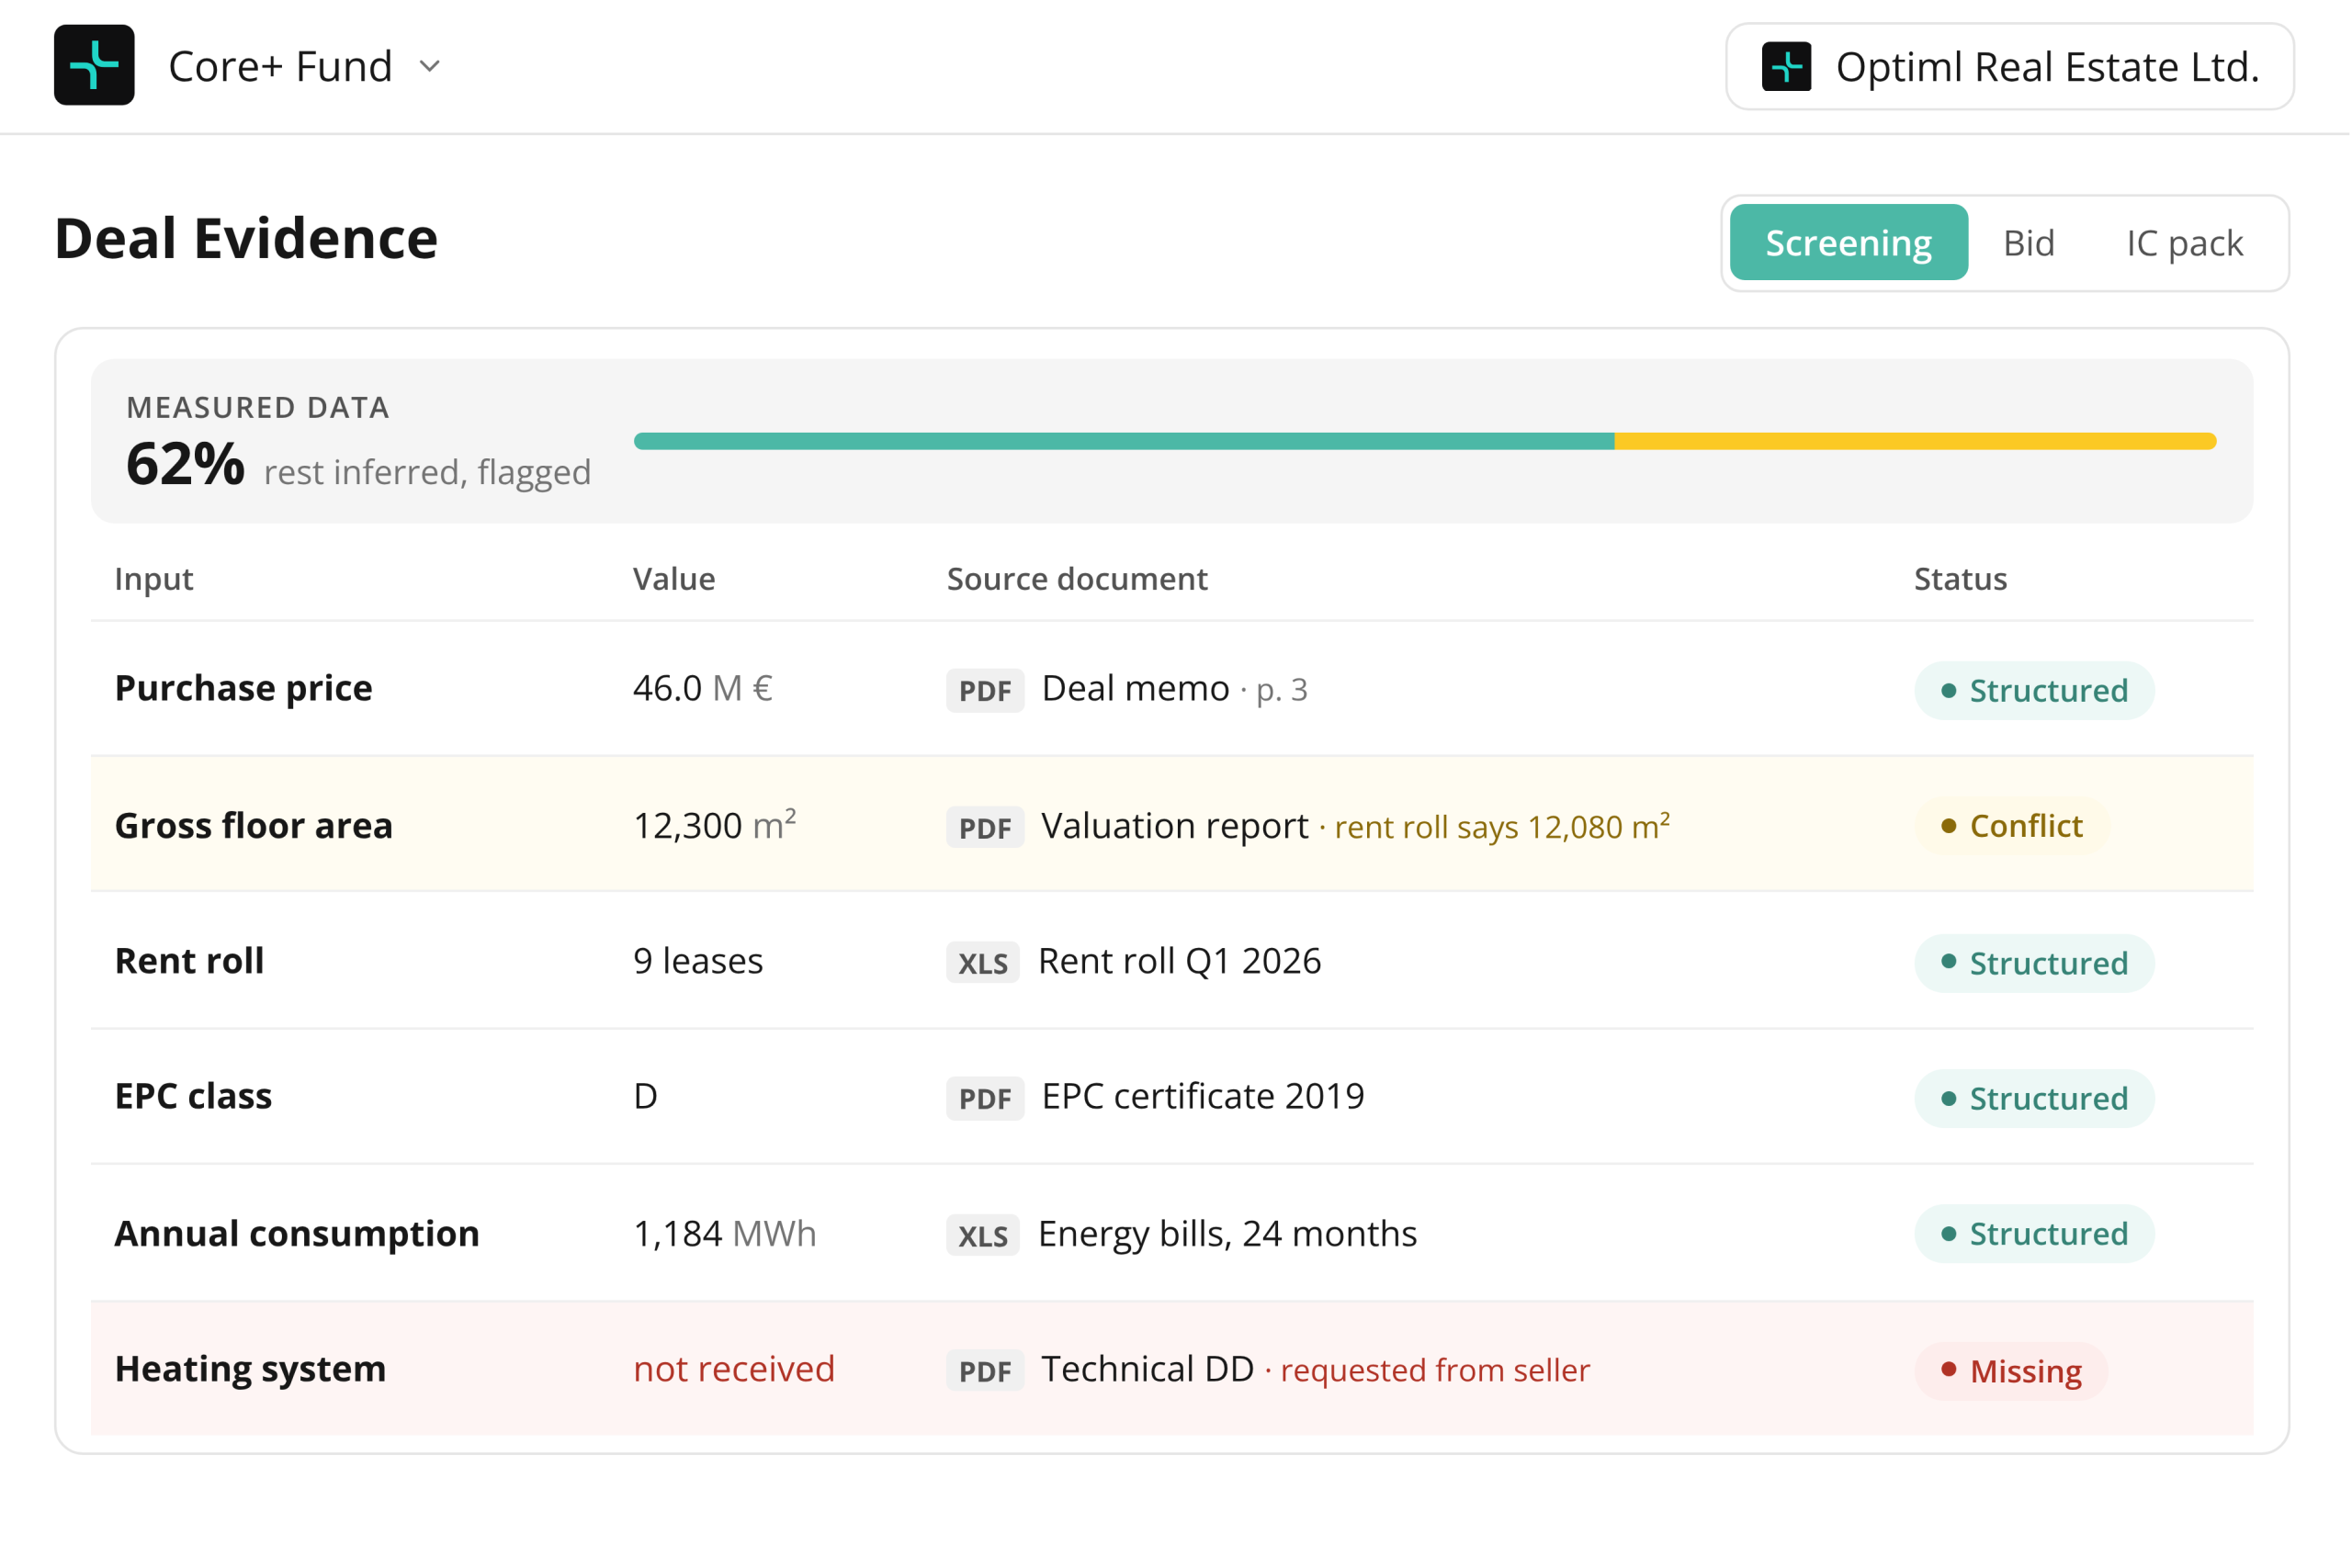
Bring EPCs, technical DD, valuations, rent rolls, and financial files into a structured review process that identifies missing or conflicting inputs rather than concealing them.
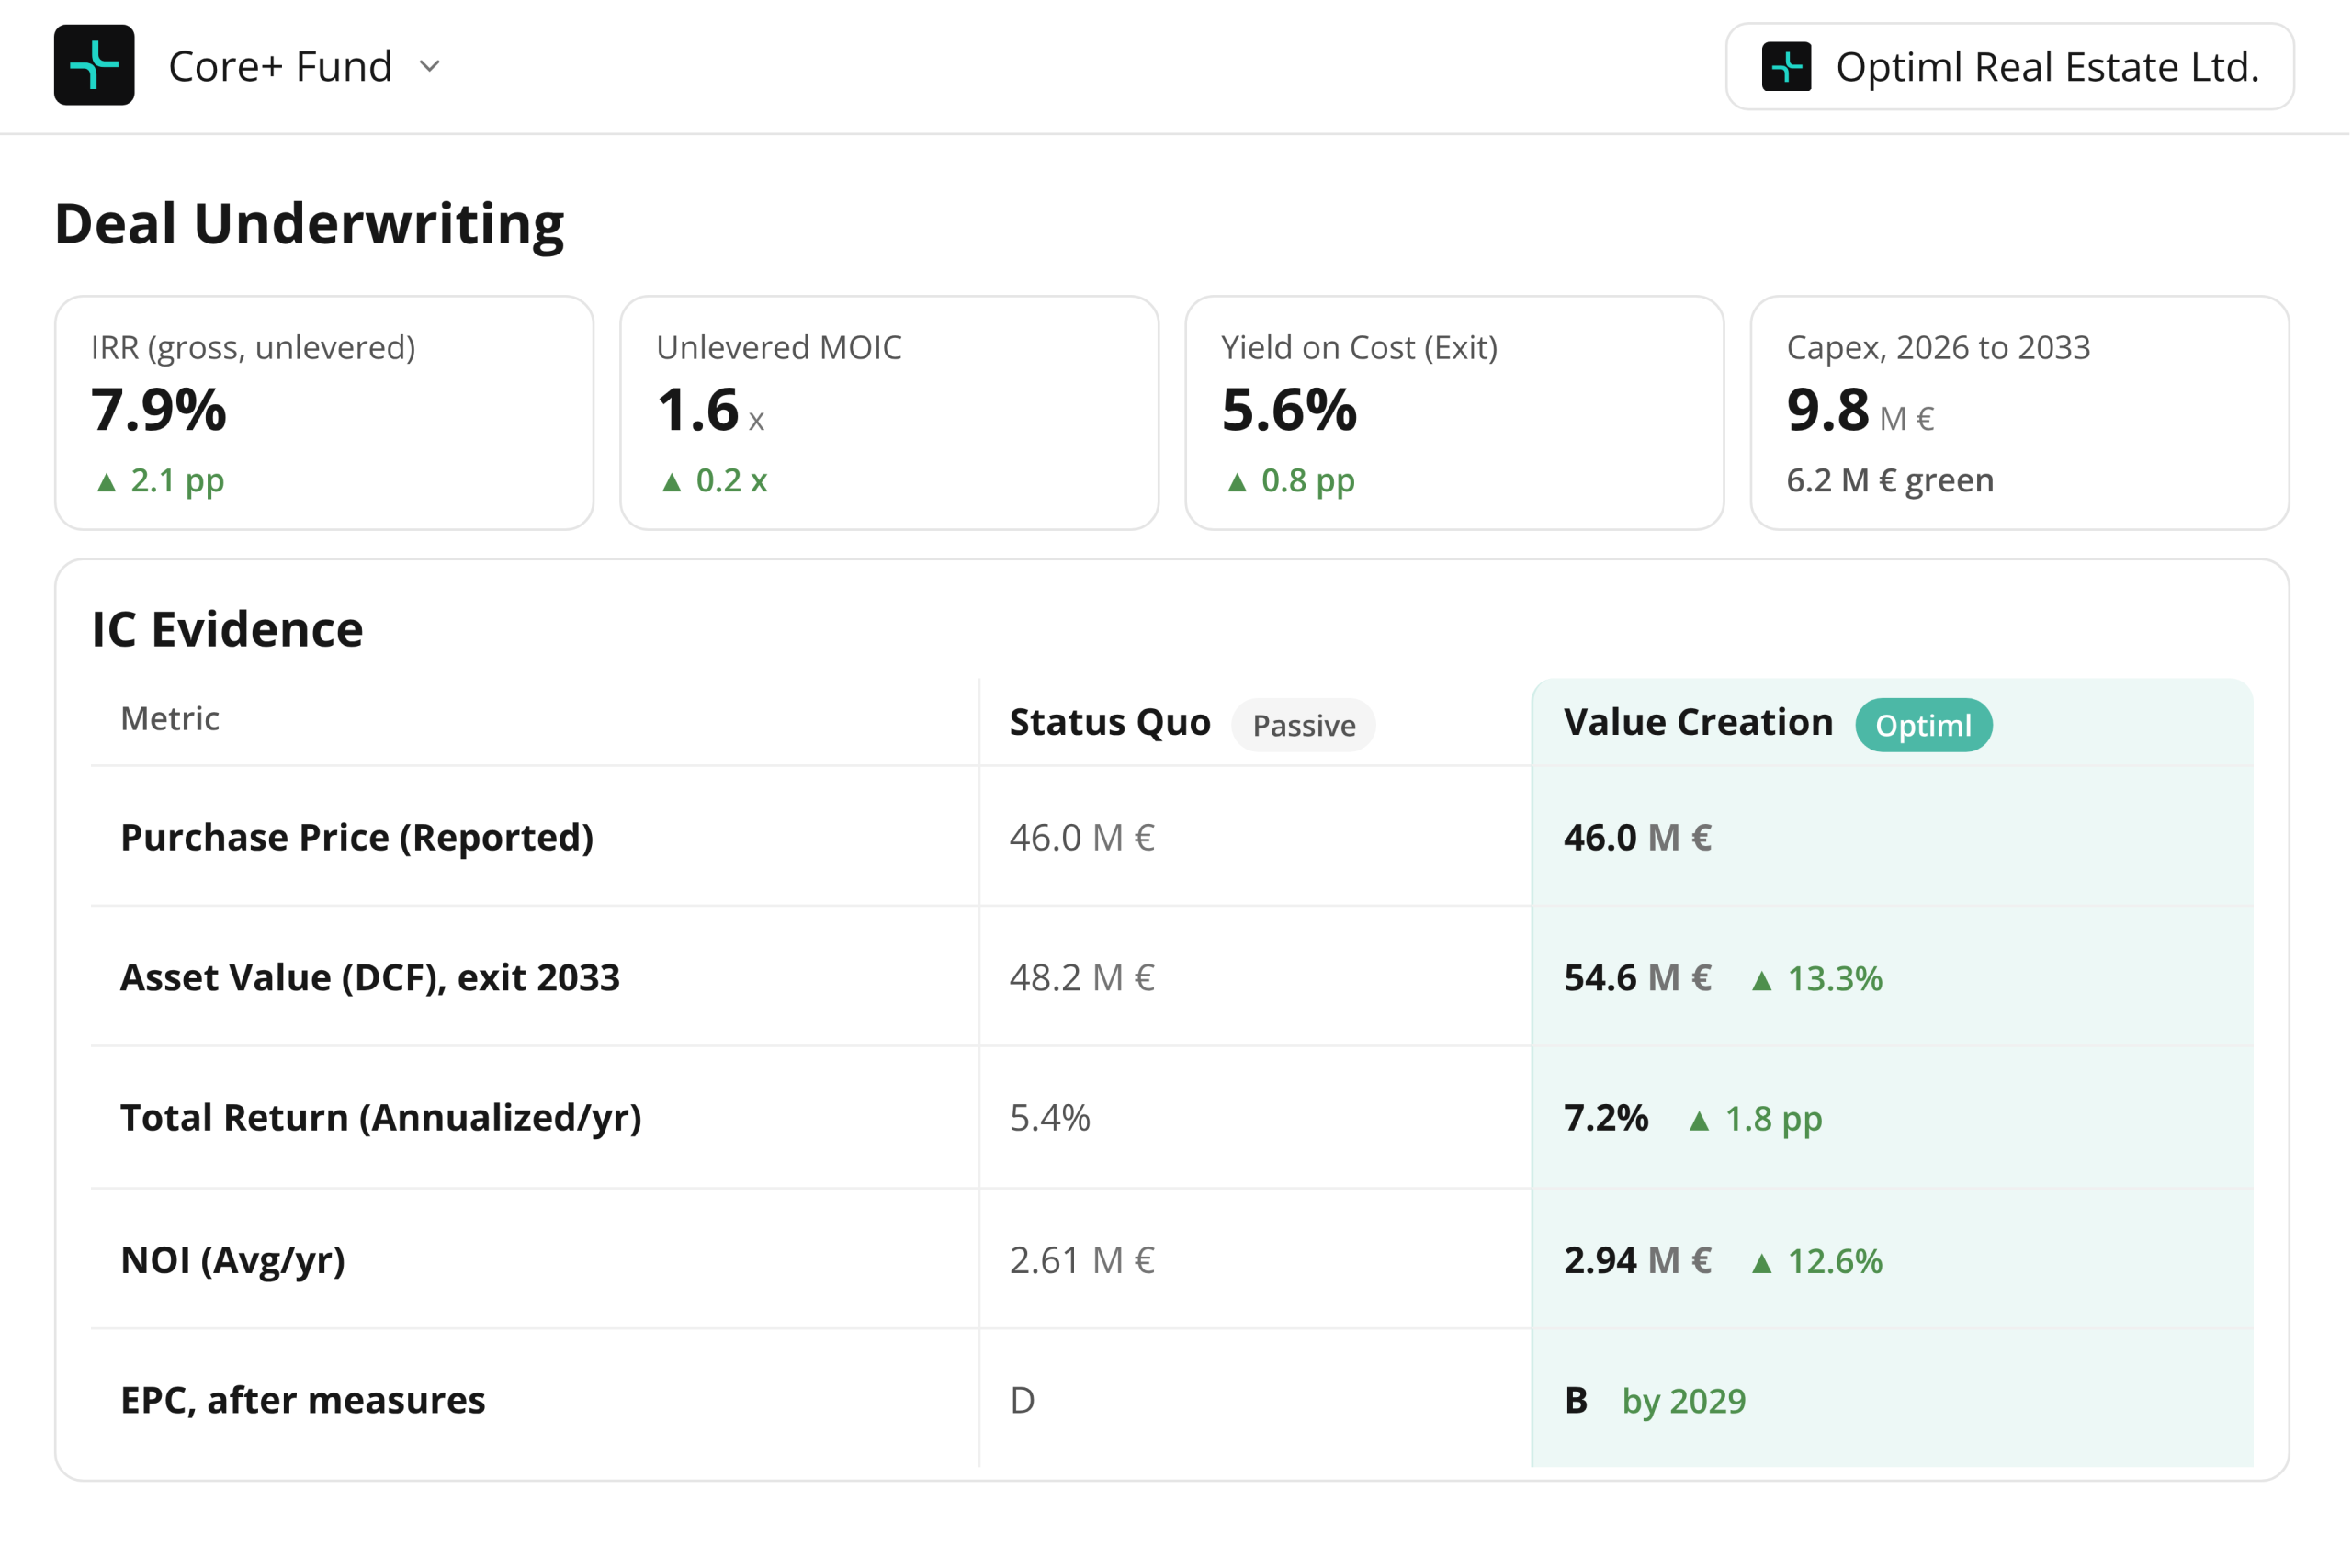
Unlevered IRR, yield on cost, Capex, and transition outcomes across acquisition and value-creation options in the fund context for the IC.
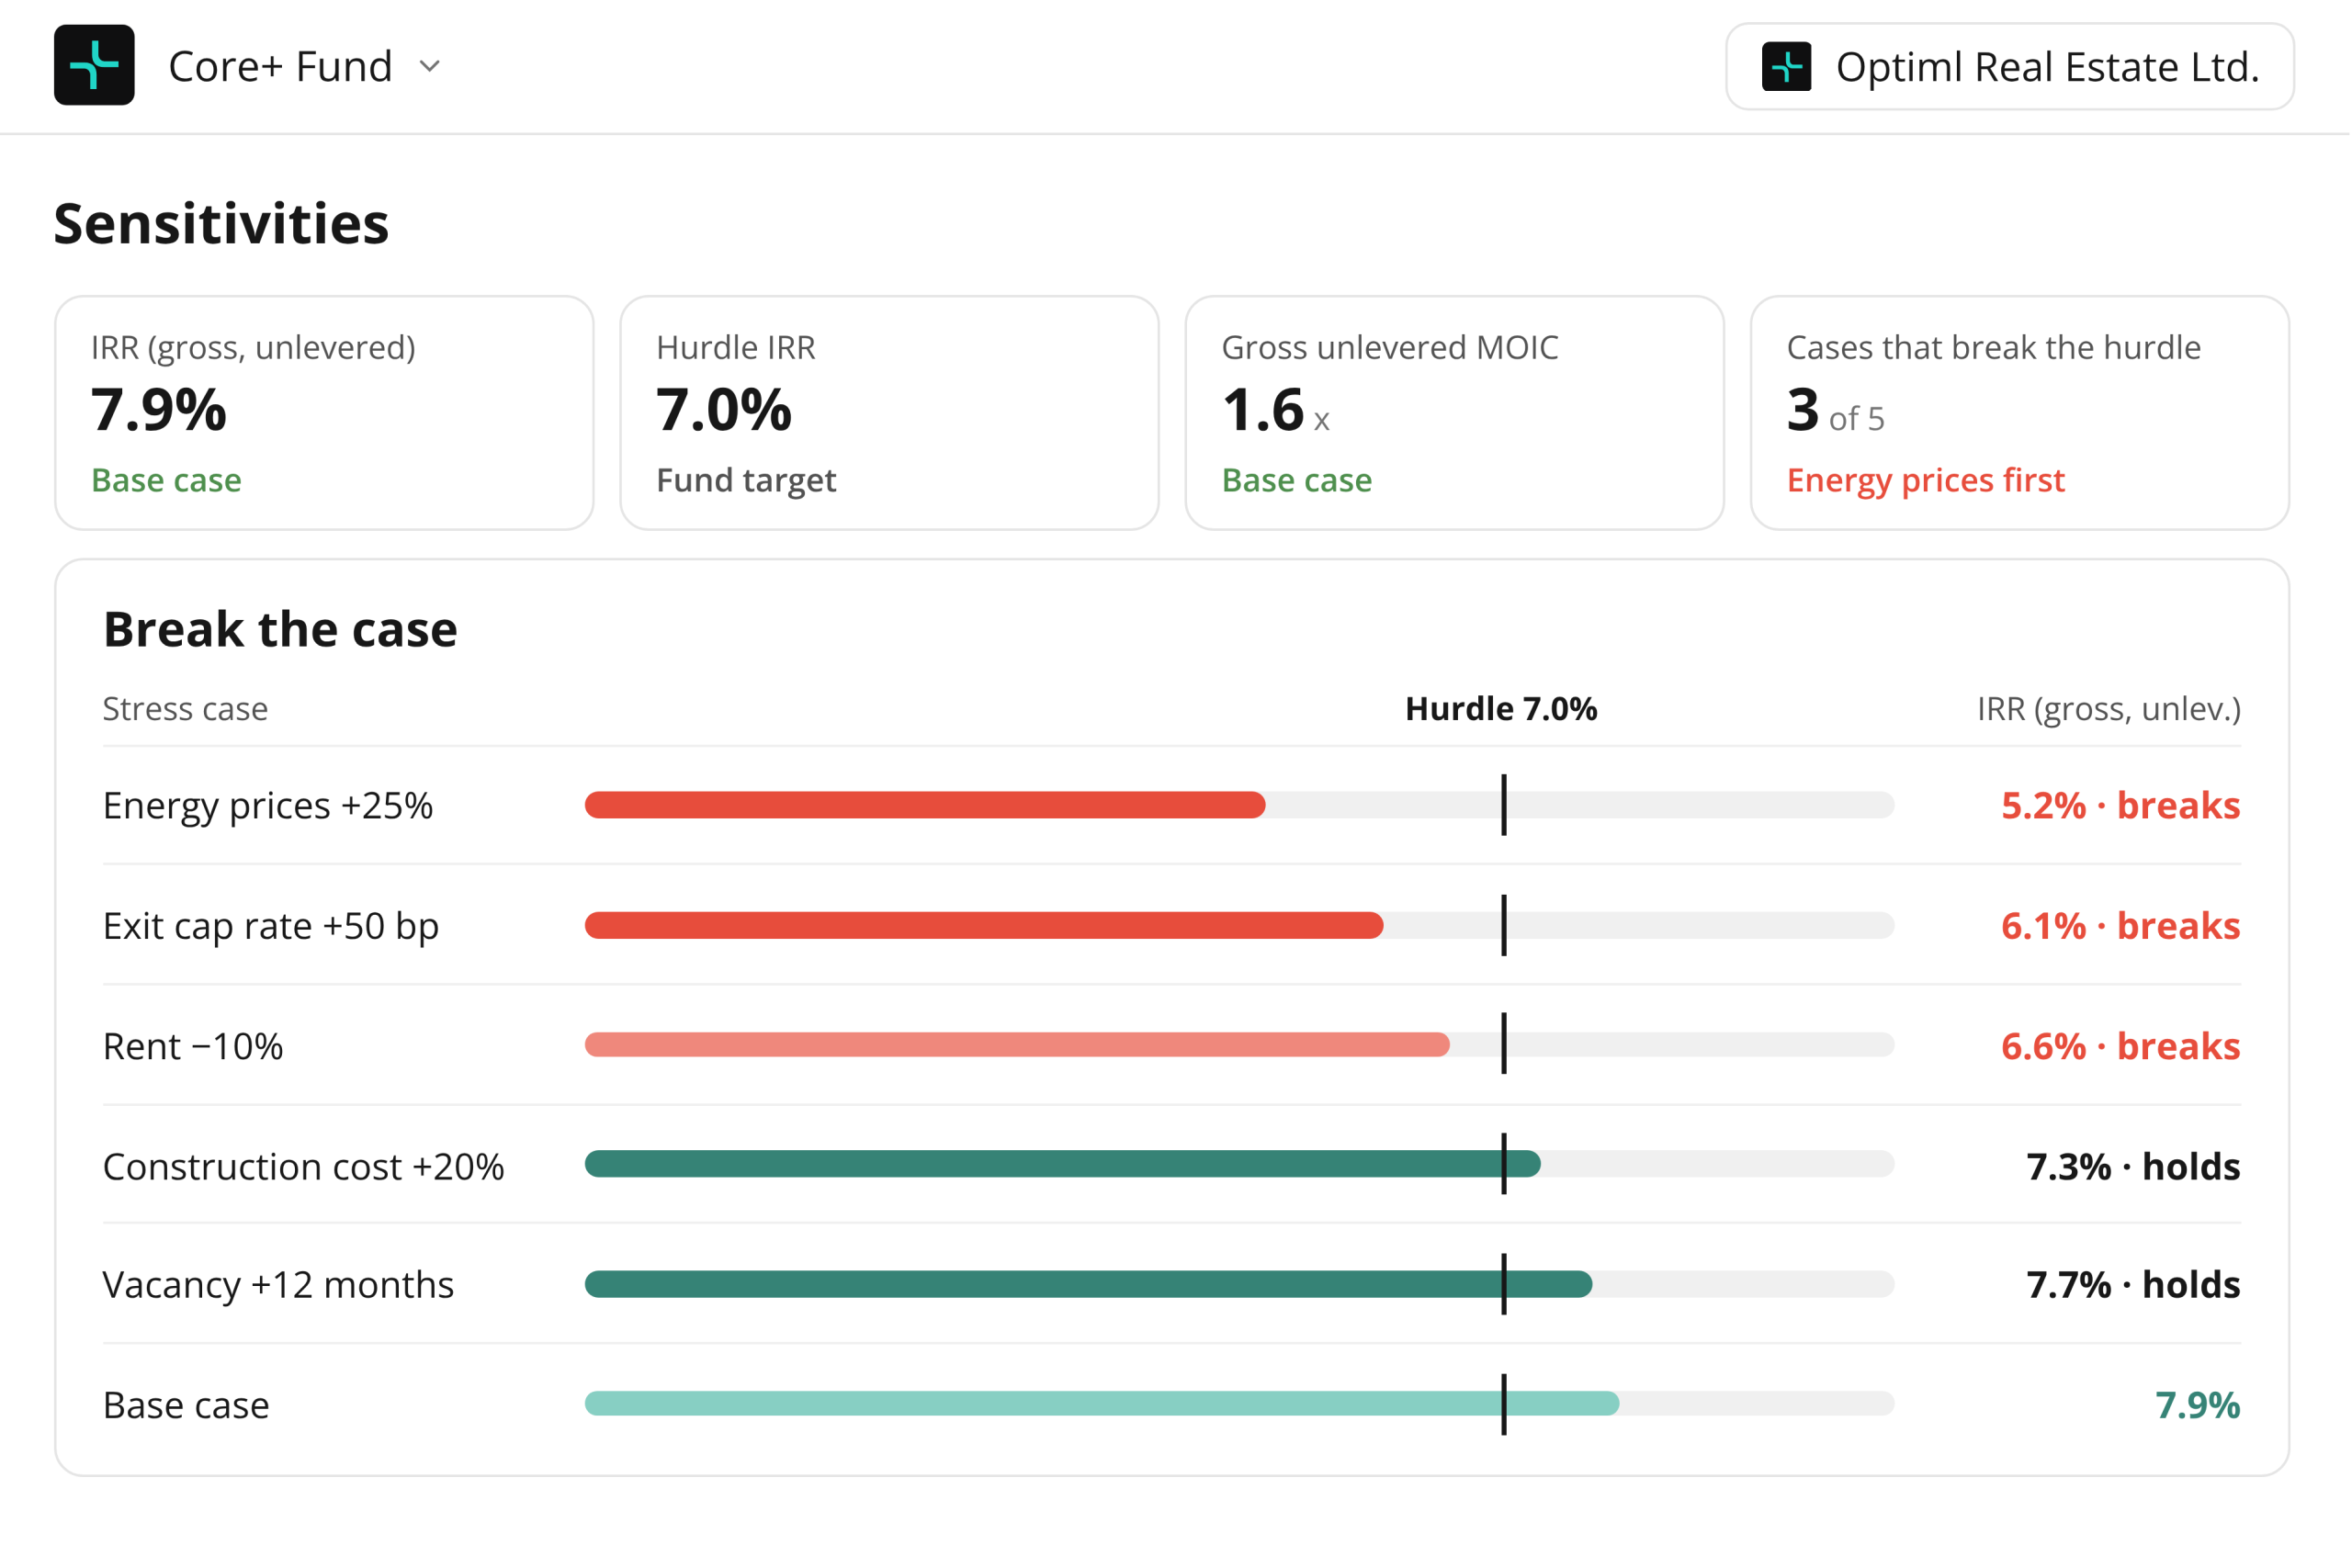
Compare the investment case under alternative rent, cost, energy prices, and Capex assumptions to identify conditions that could change the recommendation.
How PATRIZIA uses Optiml across funds, asset classes, and investment transactions to identify more efficient Capex pathways, protect portfolio value, and make financial trade-offs visible to investors.
UK advisory team combined building evidence, indicative modeling, and professional judgment in a multi-property assessment, moving from fragmented source inputs to comparable EPC and retrofit scenarios on a transaction timetable.
Catella Investment Management used Optiml’s REDI platform to compare different investment and decarbonization pathways for Catella European Residential III (CER III).
How Pensionskasse der Bewag worked with FREO, pom+, and Optiml to compare investment pathways, identify a lower-capital approach, and translate portfolio climate ambitions into actionable planning.
Core+ office fund, GAV €800M, five European countries. Three fund strategies and asset-level hold, sell, and monitor plans to 2035.
A first assessment takes minutes. Enter the address, construction year, use type, and gross area, and Optiml returns the current energy and carbon position, the CRREM stranding risk, and a first set of strategies with indicative Capex. As due diligence data arrives, the same asset is refined rather than rebuilt.
Capex benchmarks come from national cost databases such as BKI (Germany) and BCIS (United Kingdom) and from Optiml's own multi-source benchmark distributions at postal-code granularity, refreshed semi-annually. For each component and location we assemble cost data points from developers, consultants, and databases, apply the local median, and extrapolate to thinner locations through labor-cost drivers. All cost parameters remain editable.
Green Capex is the delta against a like-for-like replacement. If an improved facade costs €700k and the like-for-like replacement €500k, the green Capex is €200k. Optiml reports this per intervention as a marginal Capex table, so the incremental cost of the transition path is visible separately from maintenance you would spend anyway.
Every strategy is expressed in the terms your Investment Committee uses: Capex and Opex over time, NOI, cash flows and DCF valuation, IRR, and value impact, alongside energy and carbon outcomes. Rents, values, discount rates, and cost assumptions are visible and editable, so the financial case can be challenged line by line.
Fund life, hold period, exit year, and liquidity limits are the constraints that make a capital decision fund-specific rather than generic. Strategies can be run and compared under different exit and budget assumptions, so you can see which assets to renovate then sell, hold, or exit, and which works pay back before the exit date.
Yes. The decision pack is designed for the people who approve, fund, or challenge a capital decision: it shows the recommendation, the alternatives, the assumptions, the sensitivities, and the evidence behind each number, and it can be reproduced and refreshed when conditions change.
See how Optiml turns your building data into capital decisions your IC, lenders, and LPs can approve. Deterministic logic. Visible assumptions. Your decisions.