Targets tied to capital decisions
Transition targets translated into capital decisions the IC approves.
















CRREM, EPC, CO₂e, and regulatory targets connected to Capex, NOI, NAV, and IRR in one decision model.
Which assets strand, when, and the lowest-cost viable path to the portfolio target.
Regulation, targets, budgets, and leases captured and applied across every scenario.
Aligned to governance, regulatory, and lender requirements, with audit trail.
REAL ESTATE DECISION INTELLIGENCE
Explore the platformOptiml combines financial & decarbonization planning, defines strategies to transition assets & funds towards Net Zero, meeting financial goals.



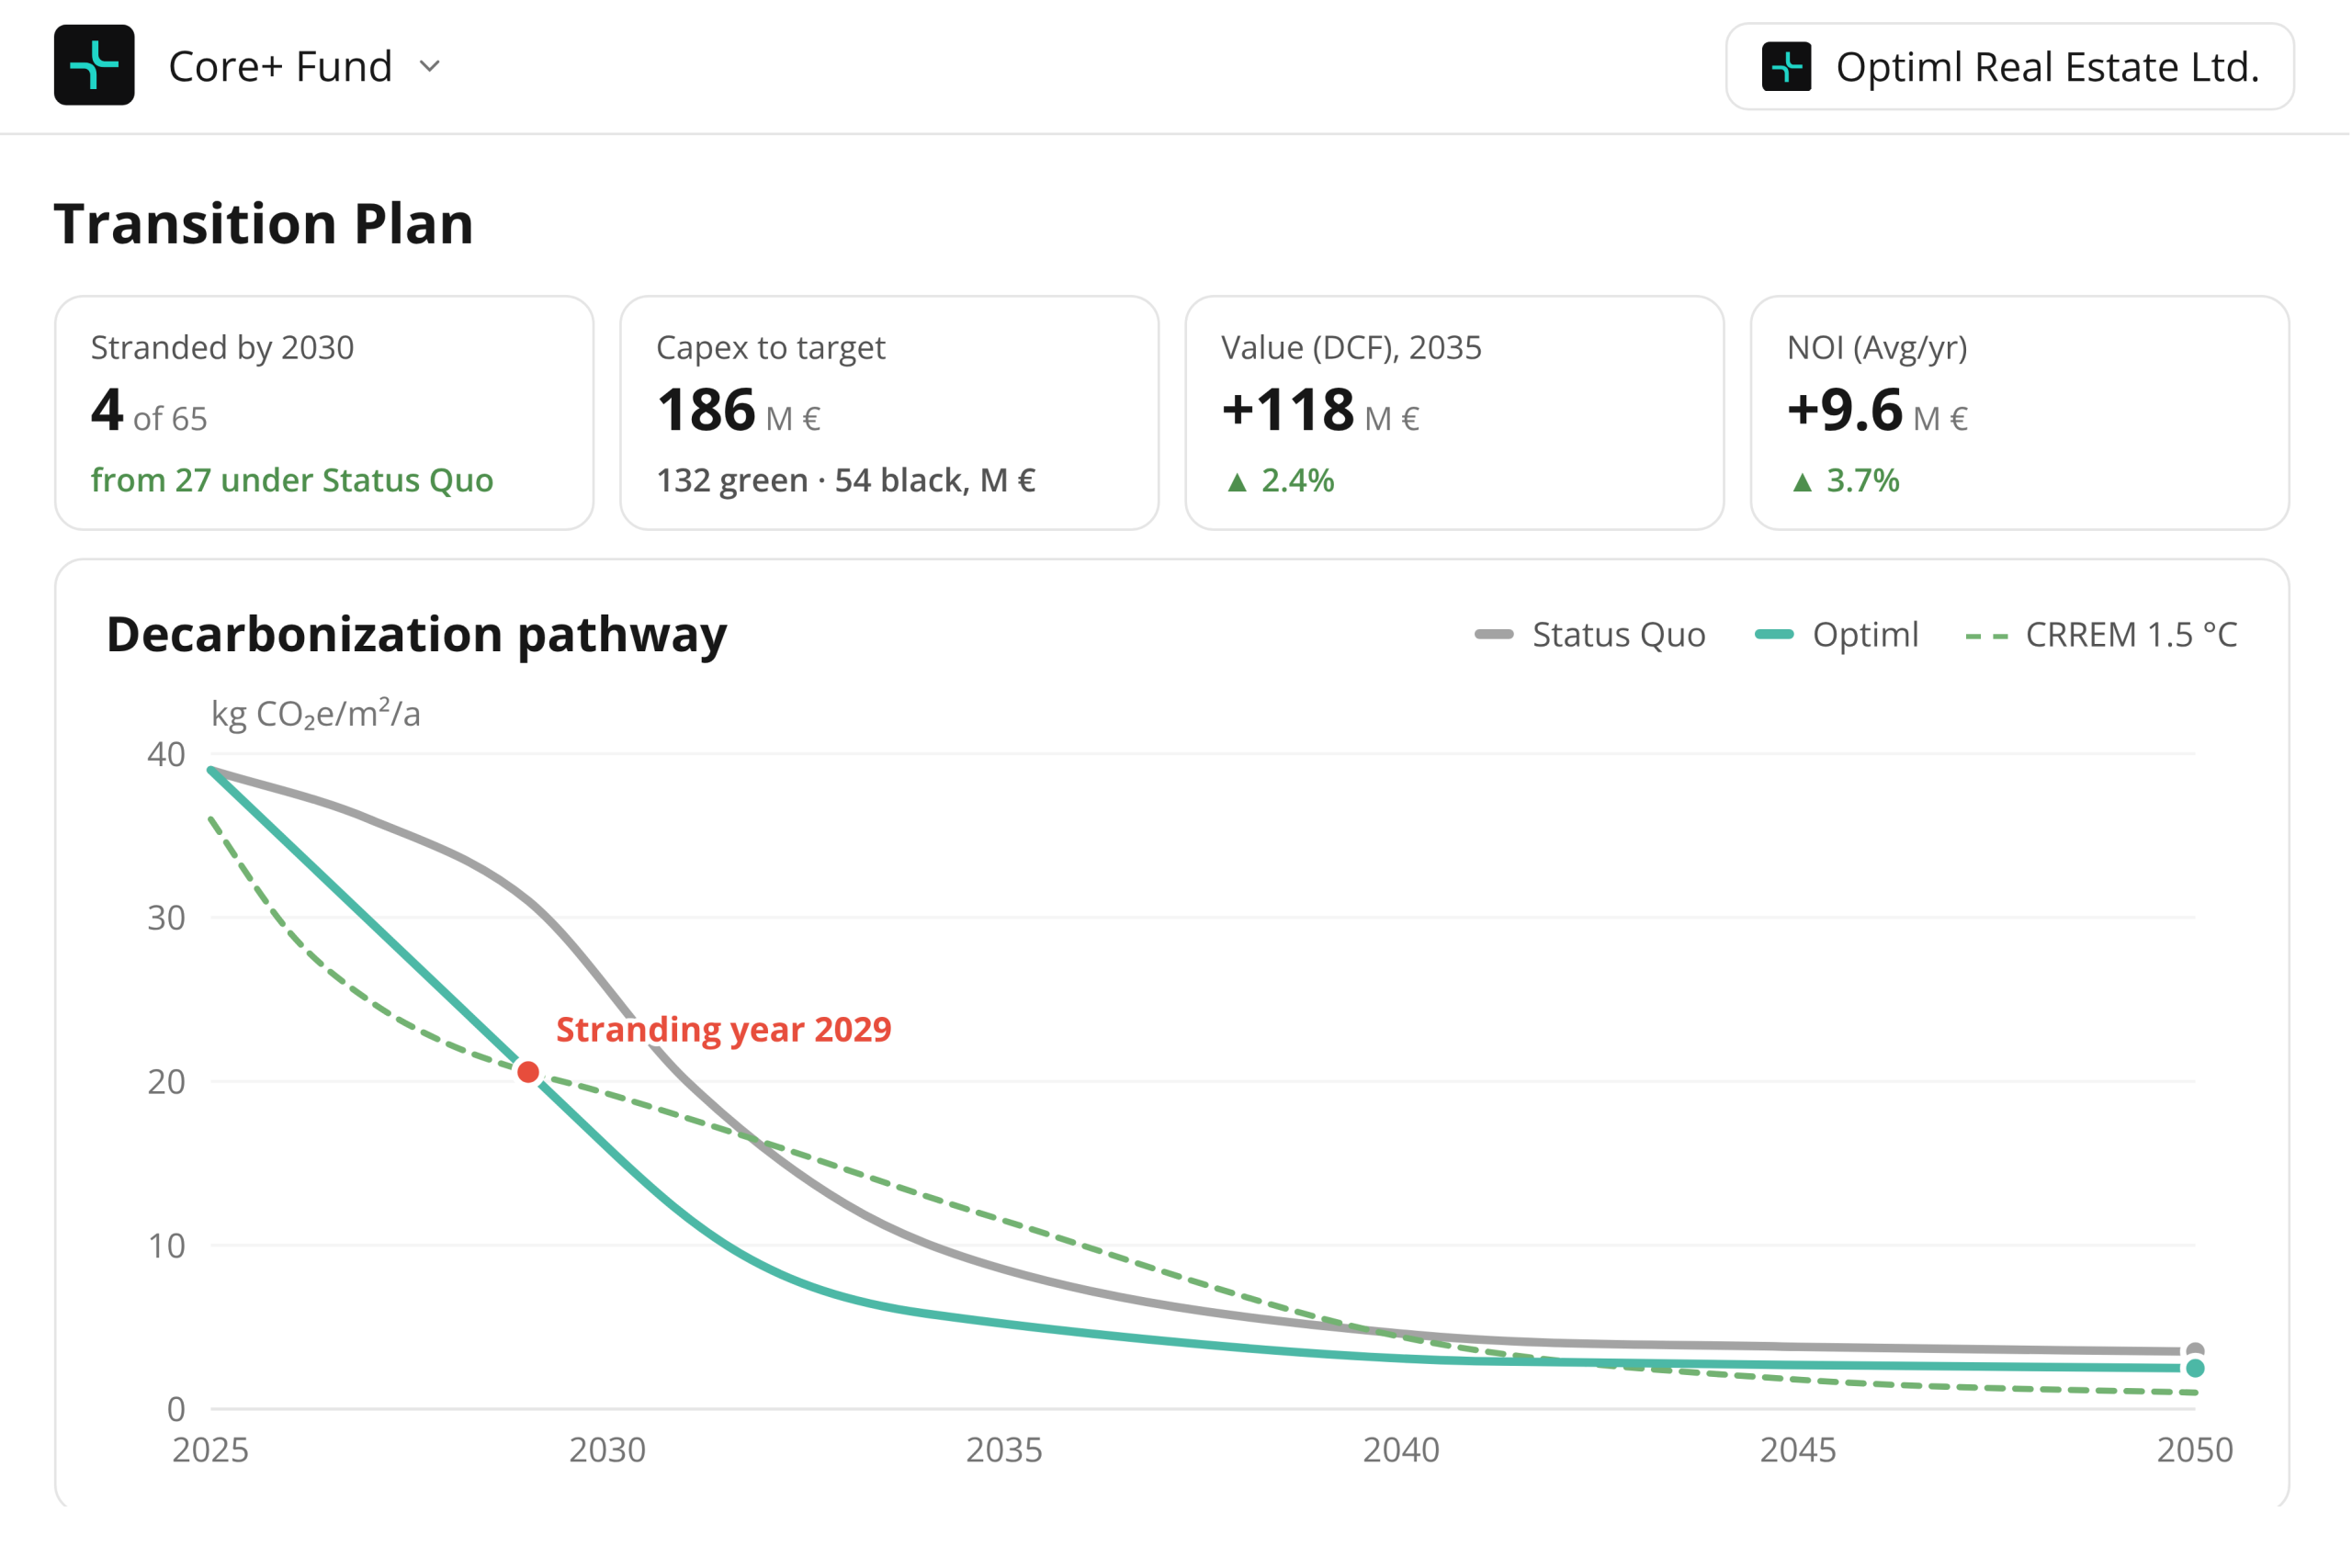
Compare building exposure with CRREM and EPC assumptions, assess the Capex, timing, and financial consequences of alternative paths.
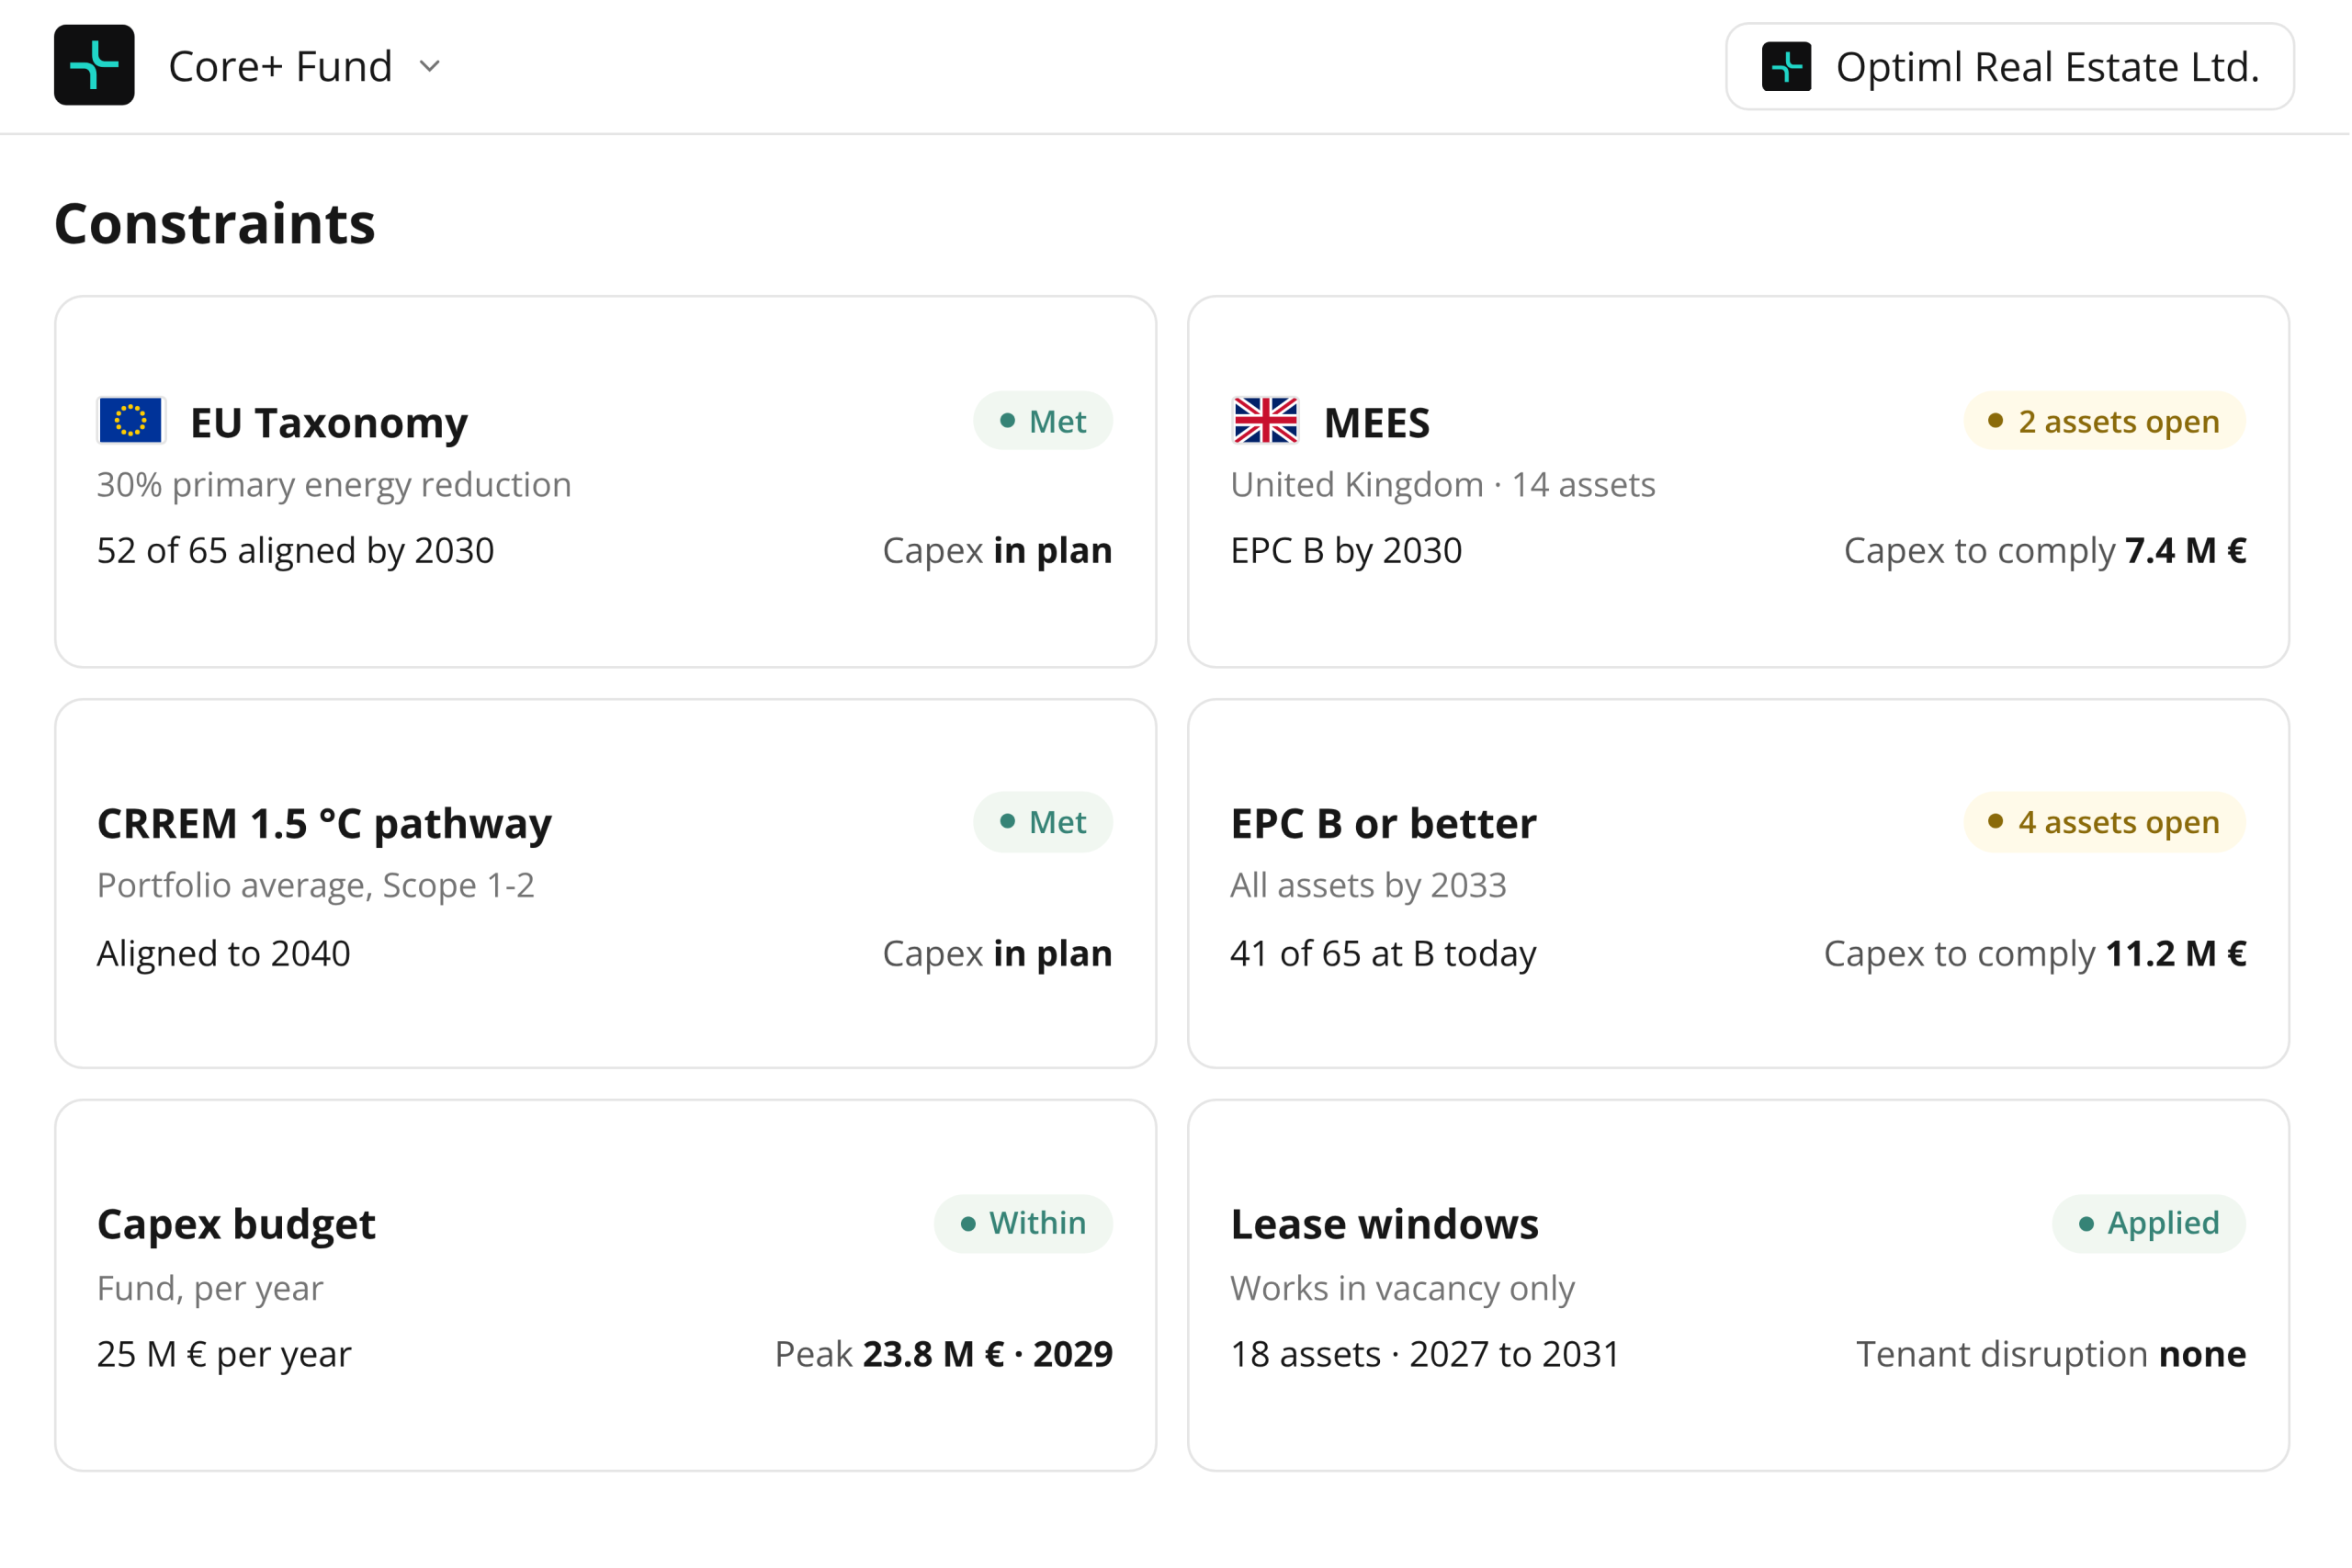
EU Taxonomy, national energy codes, EPC & CO2 targets, budgets, and lease windows applied to every scenario, so the plan is compliant by construction, not checked afterwards.
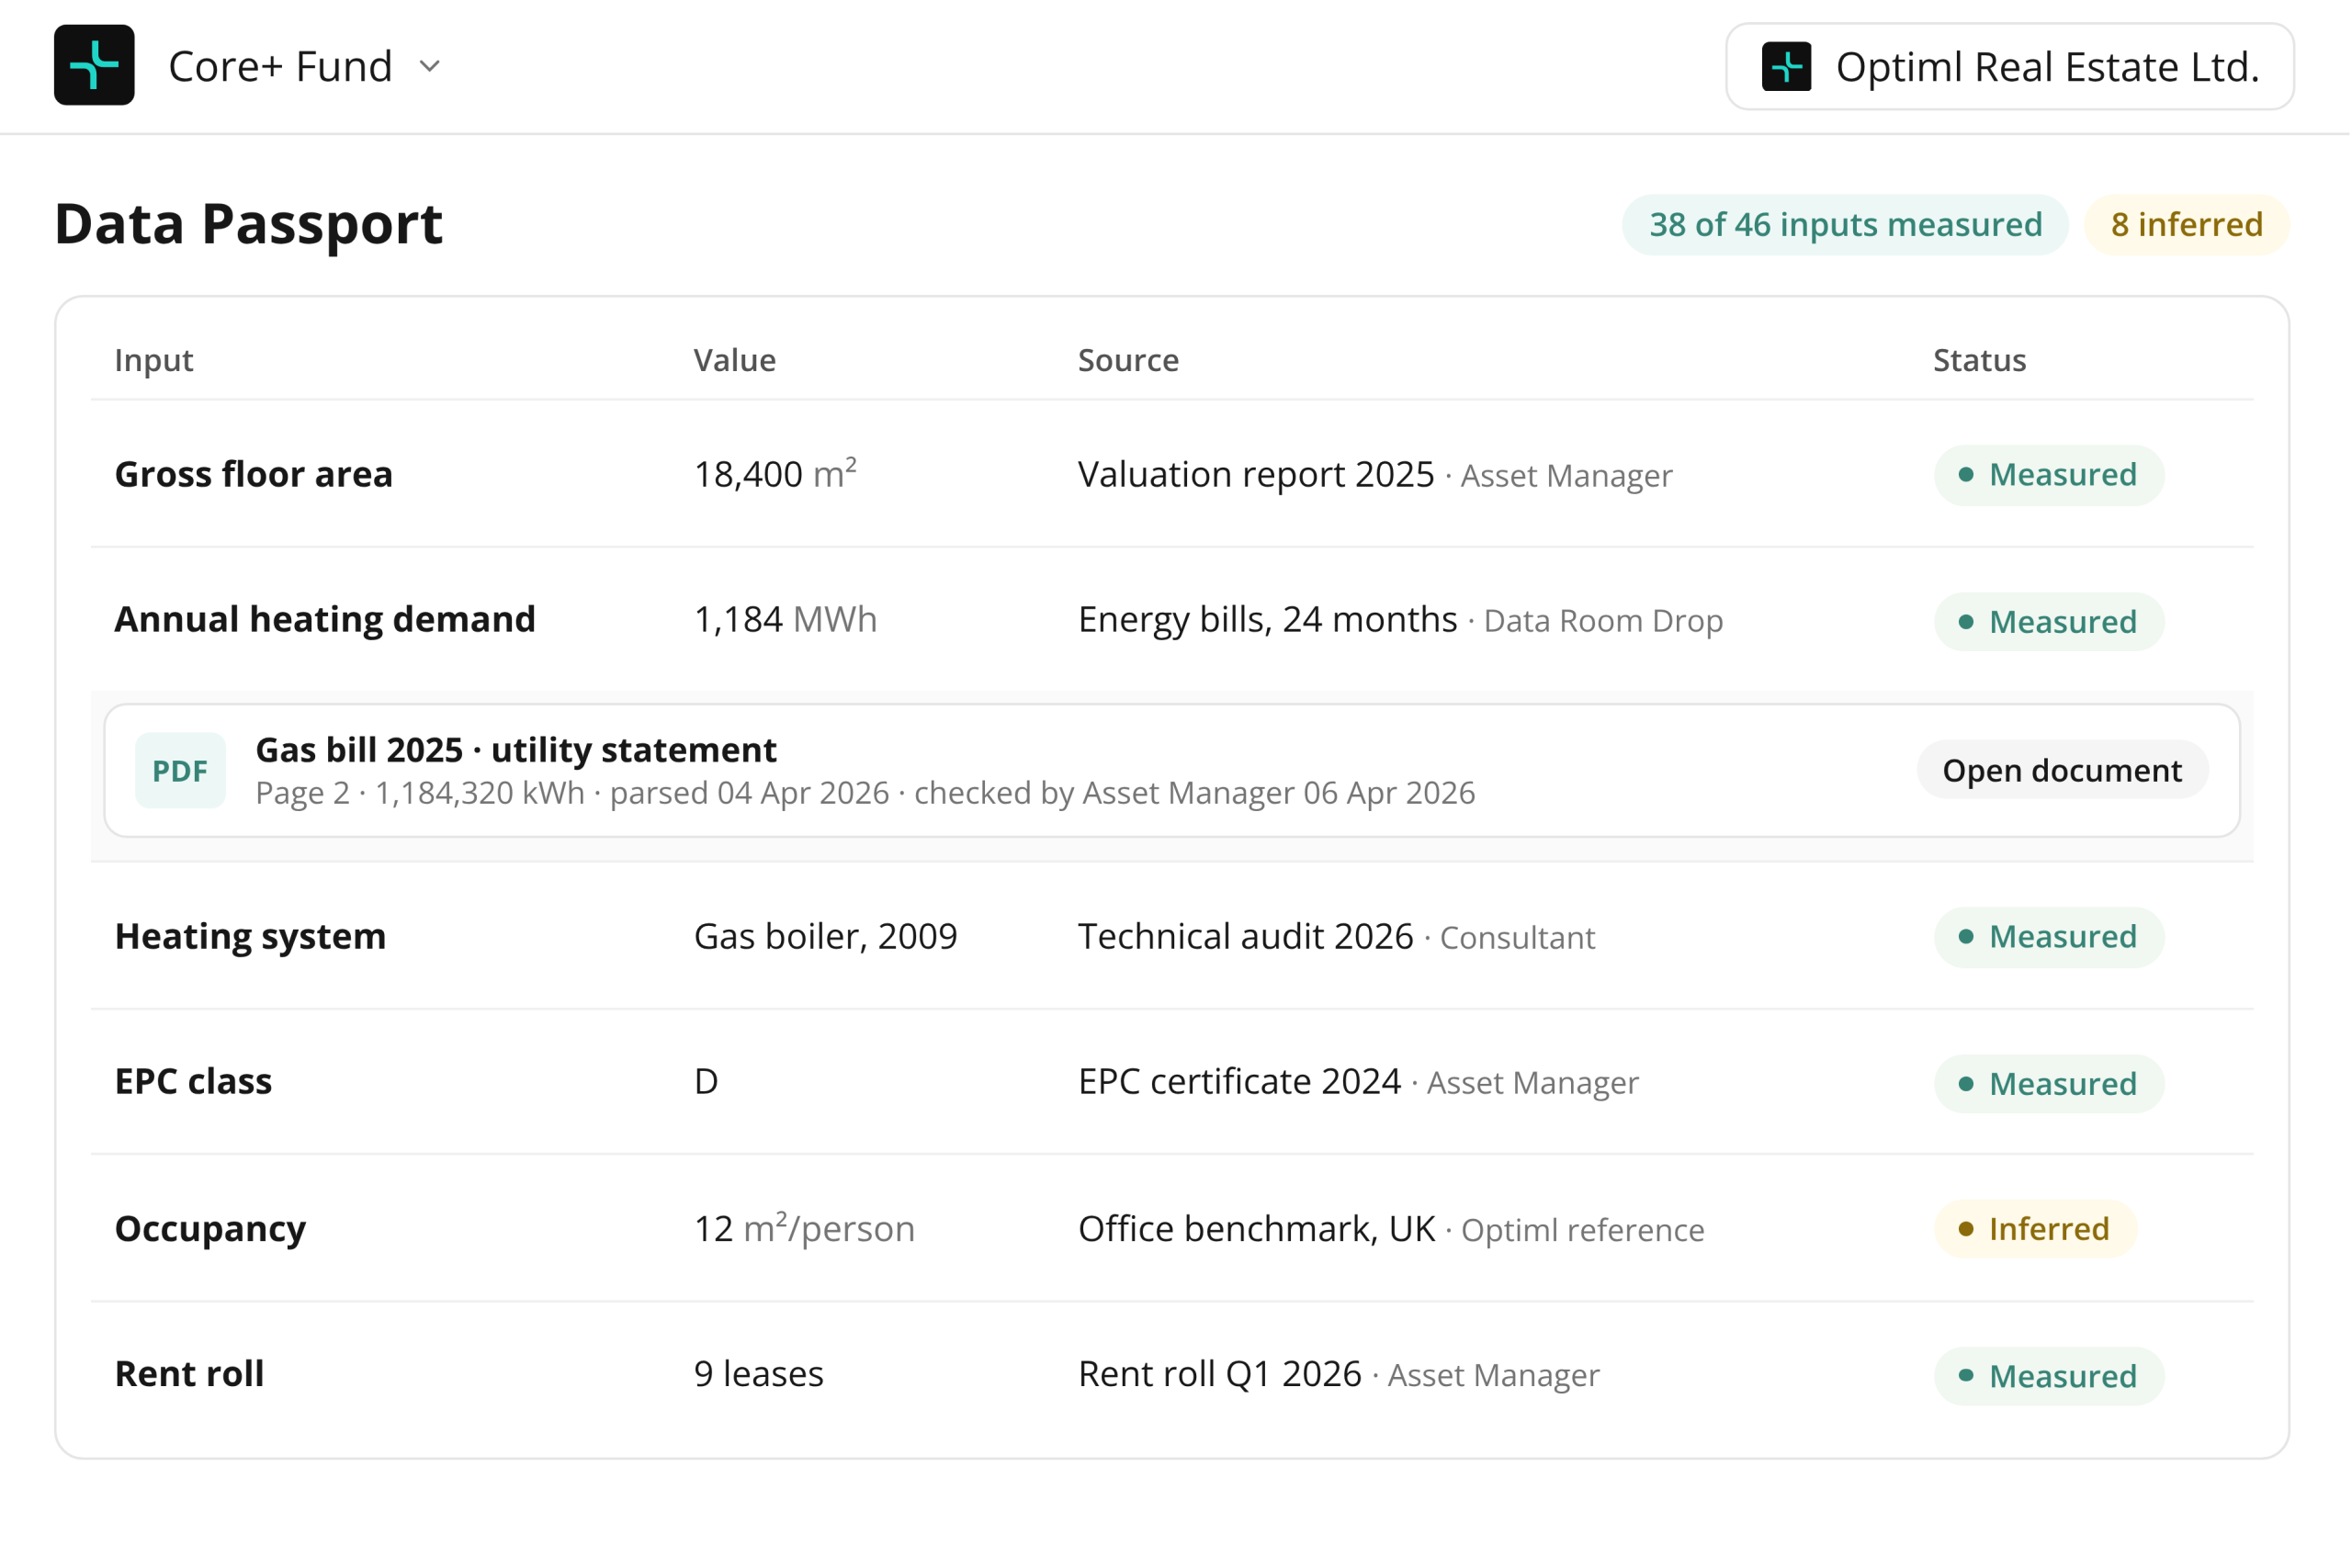
Show documented sources, dates, and measured versus inferred inputs, so financial and technical reviewers can challenge material assumptions before approval.
How PATRIZIA uses Optiml across funds, asset classes, and investment transactions to identify more efficient Capex pathways, protect portfolio value, and make financial trade-offs visible to investors.
UK advisory team combined building evidence, indicative modeling, and professional judgment in a multi-property assessment, moving from fragmented source inputs to comparable EPC and retrofit scenarios on a transaction timetable.
Catella Investment Management used Optiml’s REDI platform to compare different investment and decarbonization pathways for Catella European Residential III (CER III).
How Pensionskasse der Bewag worked with FREO, pom+, and Optiml to compare investment pathways, identify a lower-capital approach, and translate portfolio climate ambitions into actionable planning.
Core+ office fund, GAV €800M, five European countries. Three fund strategies and asset-level hold, sell, and monitor plans to 2035.
Optiml applies the official CRREM decarbonization pathways (1.5°C and 2.0°C) directly in the platform, by country and asset class, at both asset and portfolio level, and computes the stranding year for every strategy. Energy intensity pathways are considered alongside carbon pathways. Custom pathways can be defined to reflect fund targets, investor requirements, or internal commitments.
From the optimized intervention schedule, Optiml reports the Capex needed to reach 2030 and 2050 CRREM alignment as absolute figures and classifies it as high (above 10% of Capex), medium (3% to 10%), or low (below 3%), split between landlord and tenant.
Yes. For every retrofit measure, embodied emissions are calculated from the quantity of newly installed components (by kg, m², or m³) multiplied by an embodied carbon factor per unit, using the Swiss KBOB database. Embodied carbon is included in the Minimum CO₂ strategy alongside operational emissions.
Optiml optimizes each asset against its own evidence and constraints and consolidates the results into a portfolio view, where fund-level KPIs are steered against targets. Portfolio-wide rules, such as rolling out a measure across all assets within a set period or applying a standard target to every asset, can be applied on top.
Yes. With whole-building metered data, the model is calibrated to the building. With partial data, calibrated zonal projections are used. Without metered data, archetype priors apply. The basis used is declared for every output, so a reviewer can see whether a figure rests on measured, inferred, or assumed inputs.
See how Optiml turns your building data into capital decisions your IC, lenders, and LPs can approve. Deterministic logic. Visible assumptions. Your decisions.